

Dear Stephanie,
I’ve installed Google Analytics like you suggested and I’m unsure of what analytics are the most important. Which ones should I pay more attention to?
– Kelli S.
Hey Kelli!
Glad you have Google Analytics up and running, even if you aren’t exactly sure what you’re looking for… yet! The data you’re collecting is extremely valuable and the longer the history, the better.
The real answer to your question is that there really isn’t one answer; analytics vary based on what you’re looking for. There is, however, an exception. Something you’ll always want to keep an eye are any metrics that have large increases or decreases. Did your conversion rates drop? If so, find out why. Did you get a surge in visitors from a referral site? Make sure you check out what that site is saying about you.
Everyone has different goals for their business and those will shift over time. You may start by focusing on getting more visitors, watching the visitor count closely. Later you might switch focus to wanting a more engaged audience and keeping an eye on the time on site. That’s why it’s tough to give a specific answer.
 The most important metrics is something only you can decide, but I’m certainly happy to share with you some of my favorite areas to watch. This is a pretty basic overview but nice for a beginner to get a foothold. From there, you can explore the things that are most applicable to you.
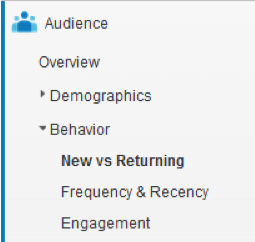
AUDIENCE
This section is a great place to start to get a big picture view of how your site is doing in terms of visitors. The New vs. Returning visitors can help you figure out if you have a following that’s growing and how many new prospects you’re reaching.
Another area to keep an eye on is the Mobile area. If you have a large percentage of your audience viewing your site on mobile but don’t have a mobile-friendly site, it’d be wise to invest in a website redesign.
TRAFFIC SOURCES
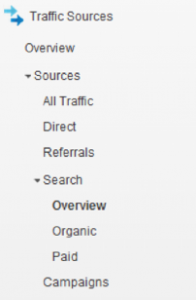
This is where you can start digging into your traffic a little deeper. You can see from the pie chart below that the majority of my traffic comes from the search engines. The overview section gives me the big picture of where my traffic comes from. But, every one of those areas is able to be broken down further.
The search section is broken down into paid and organic, with organic being the one to watch for those that are not using Google/Bing/Yahoo ads. My site hasn’t experimented in the area of paid search so I watch my organic search closely to see which keywords are doing well and if there has been a drop in traffic. I also watch the overall trend of my search traffic – is it increasing or decreasing over time?
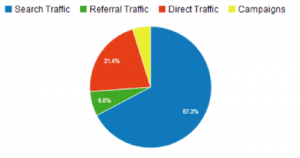
I also love keeping an eye on the referral traffic. You can see it makes up a small percentage of my site visitors but it’s a great way to stay on top of what’s being said about your company. Are they linking to your site to say they had a horrible experience? If so, you’ll want to respond to that and resolve the problem ASAP. Or maybe it’s a client you didn’t even know had great social clout and they wrote some fantastic things about their experience with you. You’ll want to make sure to tell them thank you and maybe give them an extra perk on their next booking.
CONTENT
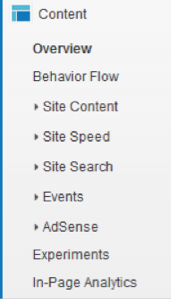 This is the area that helps me get specific analytics on the pages on the site. By looking at the overview, I can see my most popular pages and make sure I’m continually improving those to make sure the metrics are going the direction I want them to.
For instance, your most popular page may be a random article you wrote on the secrets of the MSP airport. Prospects probably won’t convert by just reading that page but if you can write articles that would interest that audience and link to those articles from that page, you’re slowly building a relationship as a trusted expert.
Again, this is just the tip of the iceberg on what you can do with Google Analytics. It’s amazingly powerful and, best of all, free. I’d encourage you to continually play around with it and watch some of the Google Analytics team’s training videos.
If you have any questions on host agencies, getting started in the travel industry, growing your home-based agency, etc. drop me a line: Stephanie@hostagencyreviews.com
Until next time,
Steph
 After a 6 year stretch as director of a national host agency, Stephanie Lee started Host Agency Reviews – a resource website with host reviews and articles to help travel agents start and grow their travel agencies. She was awarded the ASTA’s Young Professional of the Year and Travel Agent Magazine’s 30 under 30 award. As time marches on, the dates of the awards have been surreptitiously left out to avoid drawing attention to the fact she’s aging. She’s not.
You can connect with Steph on Facebook, Twitter, and Google+.
One thought on “Google Analytics”
Hi Stephanie,
I love Google Analytics as well but I hate the way the Analytics team make it harder for beginners or even for long time users analyze their site statistics. Most of their useful features are buried deep, deep inside sub-menus.
The good news is, another site have simplified Google Analytics for us who want to see the SEO statistics of our sites in one simple page – including social signals. Go to http://www.Dashfolio.com and try for yourself.
Totally free and amazingly simple….
Regards,
Manuel